

Copyright © 1995-2004 OnLineTexts.com, Inc. - All Rights Reserved
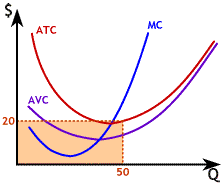 The graph to the right gives sufficient information to compute Total Cost (TC) for two different levels of output.
As shown on the graph shown to the right, when output is 50 Average Total Cost is 20 so at 50 units of output TC is 50 x 20 = 1000.
When output is 75 Average Total Cost is 40 so at 75 units of output TC is 75 x 40 = 3000.
Copyright © 1995-2004 OnLineTexts.com, Inc. - All Rights Reserved