
Whatever the reason for the rising price of milk fat, no one disputes that it is becoming more expensive, and that this is affecting the price of ice cream and the profits of the producers. Indeed, some of the major premium ice cream producers have incurred losses in the last few months. In this article we will look at how the cost of a variable input, such as milk fat, affects market price and profits. For the purposes of this article, the Ice Cream industry can be viewed as monopolistically competitive with restricted entry. This means that all the firms face downward sloping demand curves, but that it is possible to earn profit in the long run and that their decisions are more market-based than strategic reactions to other firms in the industry1.

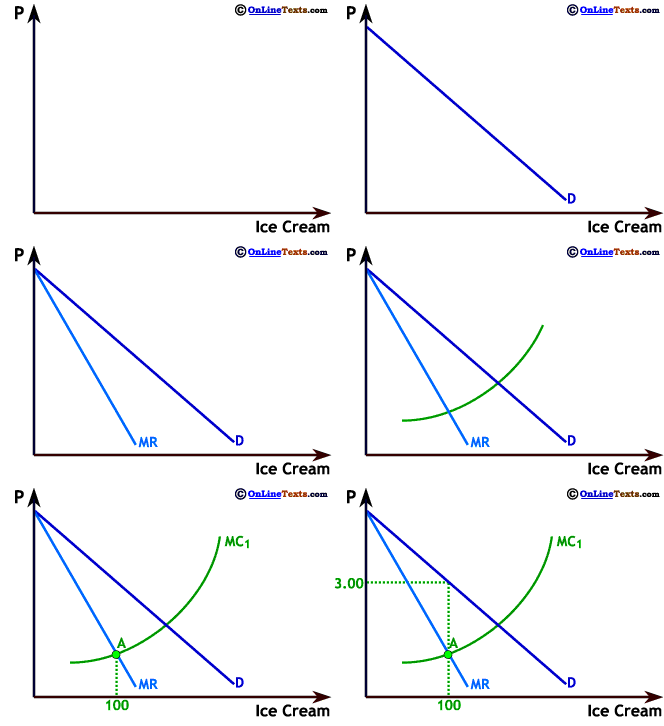
To the right we show a possible profit maximizing solution for a premium2 ice cream producer. As with any other profit-maximizing monopolistic competitor, optimal output would be where Marginal Revenue (MR) and Marginal Cost (MC) are equal. This point is labeled A on the graph to the right. This particular producer will produce 100 units if it wishes to maximize profits. The profit maximizing price can be found by following a vertical line up from 100 units to the demand curve, D. The demand curve tells us that the firm will sell 100 units if it charges a price of $3.00 per pint. This is the profit maximizing price, at any price higher fewer than 100 units would be sold, while at a lower price consumers would wish to buy more than 100 pints, but the added cost of producing them would be greater than the added revenue. (The price and level of output shown are not based on any market data, rather they are simply used to illustrate how a profit maximizing firm would behave.) This sort of analysis assumes the Ice Cream producer knows exactly where the demand and cost curves lie. However, even if it doesn't know precisely, this approach still allows us to explain reactions to an increase in production costs.
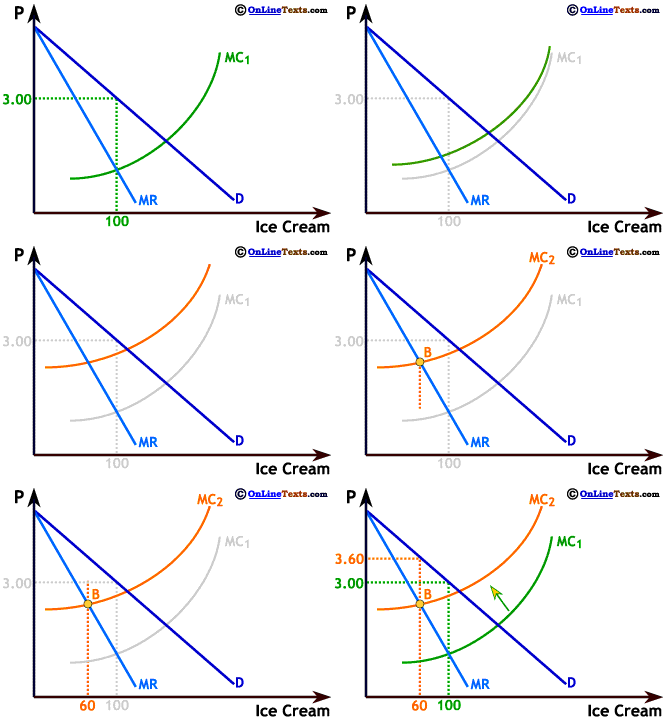
An increase in the cost of milk fat hits premium ice cream makers hardest of all. Since milk fat is a variable input, an increase in its cost shifts up the Marginal Cost curve of premium ice cream, reducing the profit maximizing level of output and increasing the profit maximizing price.

To the right we show the effect on an ice cream producer of an increase in the cost of milk fat. The marginal cost curve shifts up from MC1 to MC2. As a result of the increase in marginal cost, output falls from 100 to 60, but market price increases from $3.00 to $3.60. (Once again, these are not actual market data figures.) The vertical distance between MC1 and MC2 is the increase in the marginal cost of producing a single pint of ice cream. Even though it may not appear this way, we have drawn MC2 so that this vertical distance is the same at every point. This distance is much greater than the price increase shown. (On a separate page we show that the distance between the two MC curves is the same, and is greater than the price increase.) As is always the case when a firm faces a downward sloping demand curve, it cannot pass along a full cost increase to its customers, and any increase in price will reduce quantity sold. As we noted at the beginning of this article, we are modelling the premium ice cream industry as if it is monopolistically competitive with restricted entry. So, it is feasible for these firms to earn profits in the long run. This does not mean, however, that a change in production costs won't hurt profitability, and it certainly does not guarantee profits. As we noted, some Ice Cream producers have incurred losses recently.

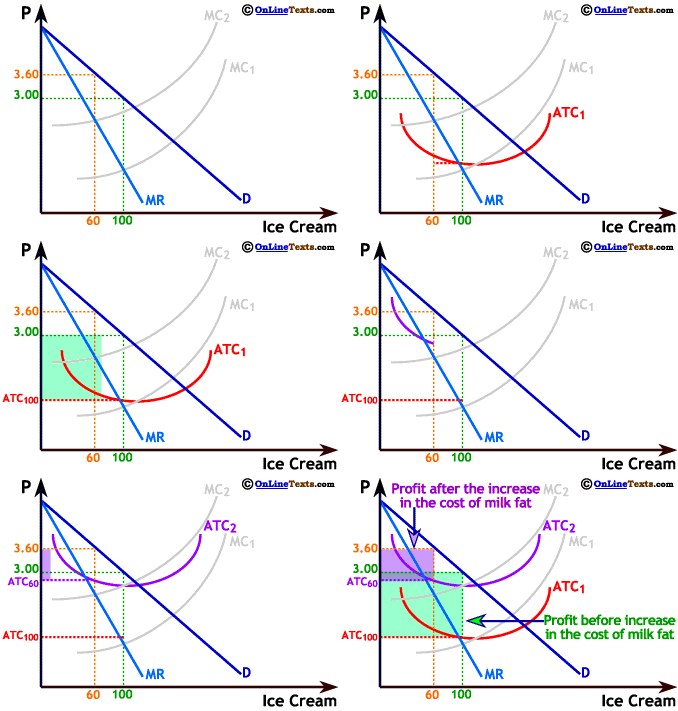
In order to show profits graphically we show average total cost curves, enabling us to show profit as a rectangular area. On the graph to the right, ATC1 is the average total cost before the increase in the cost of milk fat. The height of ATC1 at 100 units of output, ATC100, is the average total cost of production before the cost increase. The ice cream producer's total revenue is the area under the horizontal line at $3.00 and to the left of the vertical line at 100. Total cost is the area with this same width below ATC100. This allows us to show profit as the green shaded area, which is equal to (3.00 - ATC100) x 100.
After the increase in the cost of milk fat, ATC2 is the average total cost for the firm. Price has risen, quantity sold has fallen, and profits are smaller too. At the new profit maximizing level of output, average total costs are given by the height of ATC2 at 60 units of output, ATC60. We can show the profit area as we did before, this time as the purple shaded area. The higher price does not make up for the reduced sales and higher production costs. The size of the purple shaded area is (3.60 - ATC60) x 60. When we show profit before and after the price increase it is clear that profits have been hit hard by this cost increase. Even though the effect of the cost increase is not shown to scale on this graph, the reality is that ice cream makers are hurt by the increase in the price of milk fat. As we noted above, some producers are reporting significant losses for the most recent quarter.
As always, the reality of firm behavior is never quite as simple as our profit maximizing model suggests, at least in part because firms don't have perfect knowledge of market demand conditions, or even perfect knowledge of their own cost curves if they increase or decrease production significantly. Nevertheless, retail ice cream prices have been rising, and will probably keep rising for the rest of the summer, and ice cream producers are finding their profits hit hard, all as our graphical model predicts. So, while you're fuming about the high price of gasoline and electricity, you might find that a cone of ice cream is a remedy for the heat, but not for high price frustrations.
1 If ice cream producers are more concerned with the behavior of other producers than with market conditions, they would be more appropriately characterized as oligopolists.