
Copyright © 1995-2004 OnLineTexts.com, Inc. - All Rights Reserved


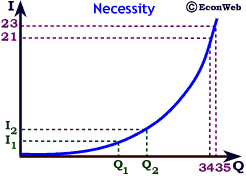
At the higher income levels shown, I1 = 21 and I2 = 23 and Q1 =34 and Q2 = 35. The arc income elasticity computation is shown to the right. The income elasticity is growing
smaller as income rises, which would be consistent with personal
care products, staple foods and similar goods.


Copyright © 1995-2004 OnLineTexts.com, Inc. - All Rights Reserved