
Copyright © 1995-2004 OnLineTexts.com, Inc. - All Rights Reserved
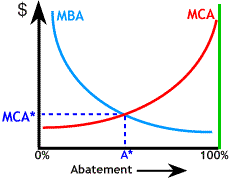
 To the right is a graph comparing the marginal benefits of pollution abatement
(MBA) with the marginal costs of abatement (MCA). Along the horizontal axis we show the amount of pollution abatement. At 0% nothing has been done to reduce pollution. As we move to the right pollution falls, due to increased abatement, until we reach 100% abatement (zero pollution).
A*, where MBA = MCA, is the optimal amount of abatement; and MCA* is the cost and value to society of removing that last unit. Reduction beyond A* would cost more than the benefits, and reduction less than A* would mean added pollution abatement benefits outweighed costs.


Copyright © 1995-2004 OnLineTexts.com, Inc. - All Rights Reserved