
Copyright © 1995-2004 OnLineTexts.com, Inc. - All Rights Reserved
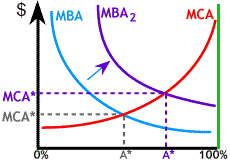
 The MBA curve represents marginal benefits of pollution reduction. Needless
to say, such benefits are extremely difficult to measure or estimate.
Suppose new estimates show pollution to be more harmful that previously thought. This is like saying the benefits of removing pollution are greater or that the MBA curve has shifted to the right to MBA2. As can be seen on the graph to the right, this means that the optimal amount of pollution reduction has increased to A*, and the amount that should be spent on the last unit removed has risen to MCA*.
The same shift would come about from an increase in the population
in the affected area.


Copyright © 1995-2004 OnLineTexts.com, Inc. - All Rights Reserved