
Copyright © 1995-2004 OnLineTexts.com, Inc. - All Rights Reserved
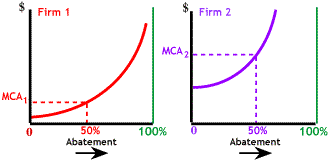
 To the right are marginal abatement costs for two firms in the
same airshed. Along the horizontal axis, pollution abatement is
increasing as are marginal abatement costs.
Notice that the two firms have different marginal cost curves,
possibly due to different technologies or different ages of the
facilities . If each firm is required to reduce its pollution
by 50%, the marginal cost of the last unit removed is higher for
firm 2.


Copyright © 1995-2004 OnLineTexts.com, Inc. - All Rights Reserved