
7 As with the other graphs, don't worry about the meaning of marginal cost at this point. Marginal Cost curves will be covered in detail in Chapter 5.

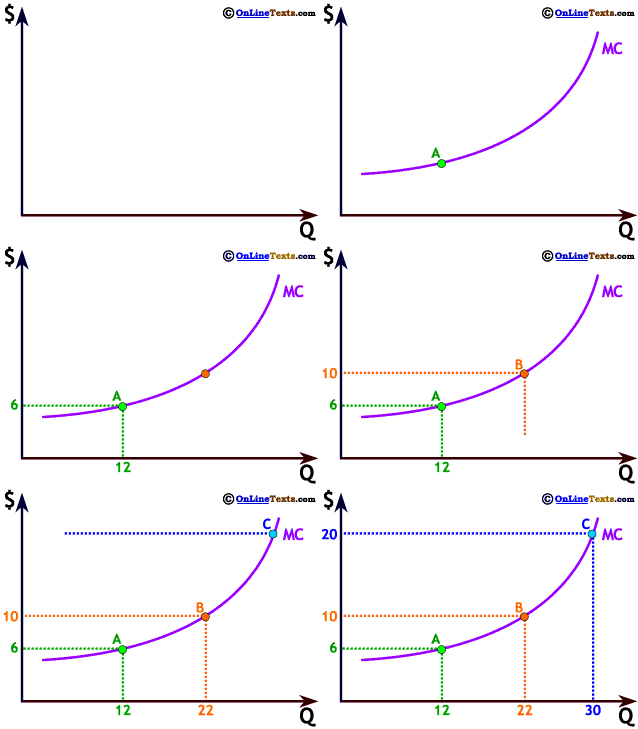
To the right we show a positive nonlinear relationship. It is a positive relationship because higher costs, $, are associated with larger values of Q. Since the graph of this relationship is a curve it is termed nonlinear. This particular graph is the upward sloping portion of a Marginal Cost, MC, curve.7
In this case, the graph to the right shows a relationship that is increasing at an increasing rate. As Quantity increases, cost increases at a faster rate. When Q increases from 12 to 22, an increase of 10 units, $ only increases from 6 to 10, or 4 units. However, when Q increases from 22 to 30, an increase of only 8, $ increases from 10 to 20, or an increase of 10 units. This relationship is increasing at an increasing rate because the greater the value of Q the faster the rate of increase in cost ($).


7 As with the other graphs, don't worry about the meaning of marginal cost at this point. Marginal Cost curves will be covered in detail in Chapter 5.