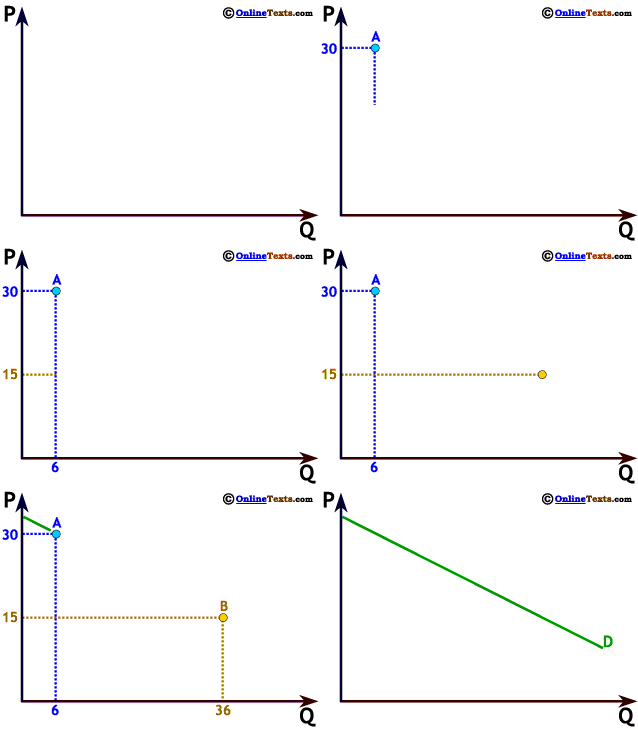


The graph to the right shows a negative linear relationship, or an inverse linear relationship. It is termed negative or inverse because larger values of P are associated with smaller values of Q and smaller values of P are associated with larger values of Q.
We plot two points on the graph. When P = 30, the value of Q is only 6, but when P falls to 15, Q increases to 36. As the value of P falls by 15 units value of Q rises by 30 units, so this is an inverse or negative relationship. As before, it's called a linear relationship because its graph is a straight line.

