
4 It's actually more correct to write "desired quantity supplied," for reasons we'll study in a later chapter, but for simplicity we often write "quantity supplied."

The slope of a linear relationship is the same everywhere, and captures the constant rate of change of one variable as a result of the change in the other. A supply curve tells us the quantity supplied4 for any given price.
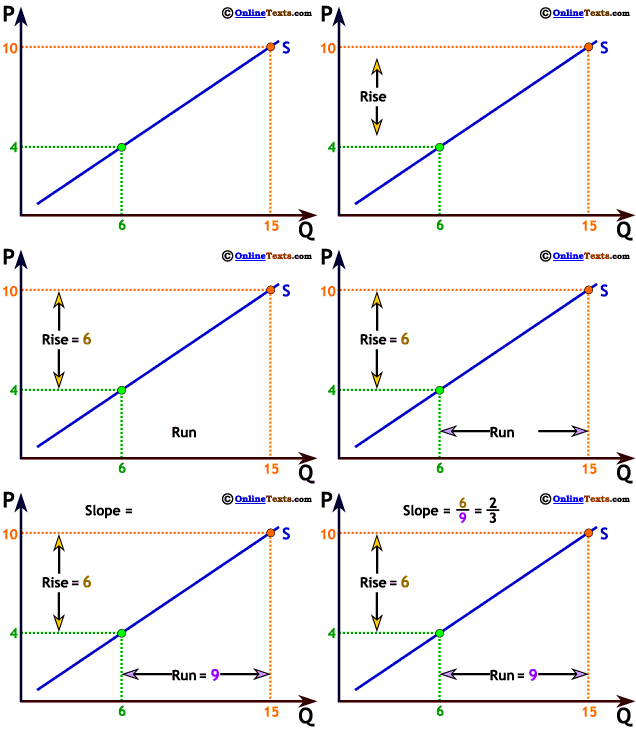
The slope is the change in the variable on the vertical axis divided by the change in the variable on the horizontal axis, or the "rise over the run." On our graph to the right, when P increases from 4 to 10, Q increases from 6 to 15. The "rise" = 6, while the "run" = 9 so the slope is 6 ÷ 9 = 2/3.
The constant slope of a linear relationship means that we know what quantity will be supplied at any price. In this case, if the price increases to 20 we know that 30 units will be supplied, and so on. This same relationship can represented by the simple equation: Q = 1.5 x P


4 It's actually more correct to write "desired quantity supplied," for reasons we'll study in a later chapter, but for simplicity we often write "quantity supplied."