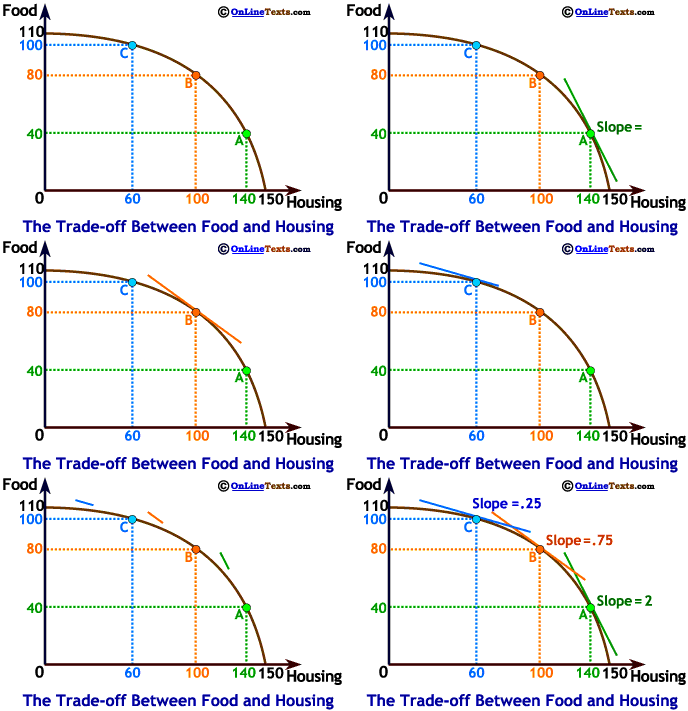

 The opportunity cost of food in terms of housing rises as more food is produced. Moving from point A to point B means 40 units of housing must be given up to gain 40 more units of food. Moving from point B to point C means giving up 40 more units of housing to gain only 20 units of food. When considering the trade-off required to move from point A to B we are tempted to say the opportunity cost is 1, and it is, on average, but the opportunity cost along a curved PPF is, in fact, different at each point. The slope at any point on the PPF represents the opportunity cost at that point.
At point A the slope = 2. When it is producing 140 houses and 40 food units, an increase of food production by 2 units requires a reduction of housing output of 1 unit. At point B, the slope = .75, meaning that when housing output is 100 and food output is 80, housing output must be reduced by 1 unit if to obtain an increase in food production of .75 units. Once the society is a point C, where food output is 100 and housing output is 60, the slope = .25. Food production is already near its maximum; further increases in food output are very costly, requiring the society to give up 4 houses for 1 added unit of food.

