
Copyright © 1995-2004 OnLineTexts.com, Inc. - All Rights Reserved
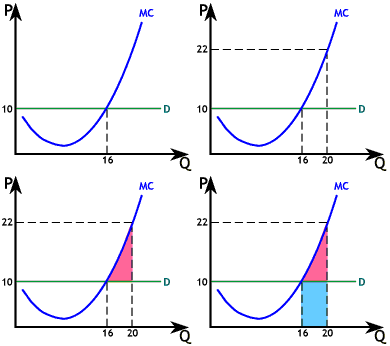
 The graph to the right illustrates what happens if a firm
produces more than the profit maximizing level of output.
For this firm 10 is the market price. Profit is maximized when output is 16, where MC = P. Suppose the firm produces 20 units. Its profits will be reduced by an amount equal to the pink area. The added cost of each unit above the 16th is greater than the marginal revenue, the market price of 10. The light blue area is the added revenue from selling units 16 through 20, while the blue plus pink areas represent added costs.


Copyright © 1995-2004 OnLineTexts.com, Inc. - All Rights Reserved