
Copyright © 1995-2004 OnLineTexts.com, Inc. - All Rights Reserved
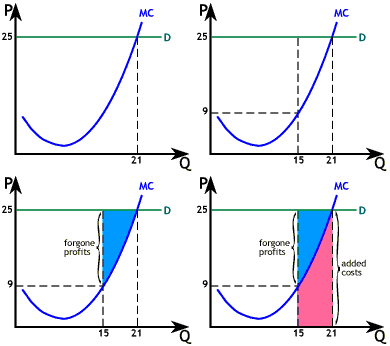
 To the right is a graph illustrating a firm which is producing
less than the profit maximizing level of output.
For the depicted firm, 25 is the market price. Profit is maximized when output is 21, where MC = P. However, the firm chooses to produce 15 units, forgoing profits equal to the light blue area. The added revenue of each unit above the 15th (market price of 25) is greater than the marginal cost, which ranges from 9 to just below 25. The pink area is added costs of producing units 15 though 21, while the pink plus blue areas represents added revenue.


Copyright © 1995-2004 OnLineTexts.com, Inc. - All Rights Reserved